The map
The main map view will be your starting point for finding data of interest to you. By selecting the tools
on the right, you can
 scroll to zoom in or out or
 zoom into a selected region.
Hovering over a track will show the track ID and the CBD number at that point. Click on any track to visit the flight
page, where you can see the collected data. If you get lost, click the
zoom into a selected region.
Hovering over a track will show the track ID and the CBD number at that point. Click on any track to visit the flight
page, where you can see the collected data. If you get lost, click the
 reset tool to zoom back out.
CBD stands for "Counter Binary Decimal." (We didn't make this up.) The CBD numbers are a monotonically increasing frame counter for each flight's data. You can just think of them as an index that connects multiple types of data recorded at the same moment in time.
By default the map shows the approximate grounded area, floating ice, and ocean in progressively lighter shades of grey. In some cases, you may need more detail to make sure you've got the right data. You can use the drop-down menu below the map to change the background to a cloud-free composite of satellite images or the MEaSUREs ice surface velocity map.
Some flights are missing location information for all or part of the flight. We're working to reconstruct as much as we can, but keep this in mind when browsing around.
Flight pages
Clicking on any track on the map will take you to a page showing the available data for that flight. Data is organized as individual images representing scanned sections of the film. Using OCR and a lot of hard work, we've labelled these images to make it easier to find them and put them together. (But you may still find some mistakes.)
In the top left is a map of all the positioning data we have for this flight. Clicking along the track on this map will highlight corresponding data in the center plot.
The center plot is a visualization of all of the data we have that is linked to this flight, with each line segment representing a film image. The X axis represents CBD numbers (effectively a time axis for the flight). The Y axis is frame numbers, which correspond to the actual order in which the film was scanned.
You can use the tools on the right to filter what is shown in the center plot. For example, in the demo above, we de-selected "Show A scopes" to view only Z scopes. You can also use the color drop-down to re-color the points by a number of parameters.
You'll usually find several continuous linear(-ish) lines on the center film segments plot. Each line corresponds to a continuous set of data being recorded on that flight. These will typically include both A scopes and Z scopes for both the 60 MHz and 300 MHz instruments carried on these flights.
To view that data itself, you can click on any segment on the film segments plot or use the
 box select or
 lasso select
tools to select multiple images at once. After selecting images, a stitched preview of these images will
be displayed immediately below the plots. (Note that this preview may take several seconds to load.
Patience is recommended, unless you'd like to sponsor our server costs. :) ) When you select images here,
the map view will show a bold line indicating the regions of the map associated with your selection.
lasso select
tools to select multiple images at once. After selecting images, a stitched preview of these images will
be displayed immediately below the plots. (Note that this preview may take several seconds to load.
Patience is recommended, unless you'd like to sponsor our server costs. :) ) When you select images here,
the map view will show a bold line indicating the regions of the map associated with your selection.
Quick note: Clicking on the map will highlight corresponding film images on the center plot, but it does not update the preview or the list of displayed film image. Only selecting film images on the center plot will actually load the data. The reason for this is that there's a one-to-many relationship between locations on the map and film images (becuase you've got multiple frequencies and scope types). This makes it very confusing to directly select data on the map. We recommend using the map to figure out roughly which set of images you want, selecting them in the center plot, and using the bolded line in the map view to verify you're looking at the region you wanted to explore.
Below the preview image, you'll see details on every individual film image you selected. More on that in a moment, but first we'll briefly go over the different types of data you'll find:
A, Z, and ESM Scope Types
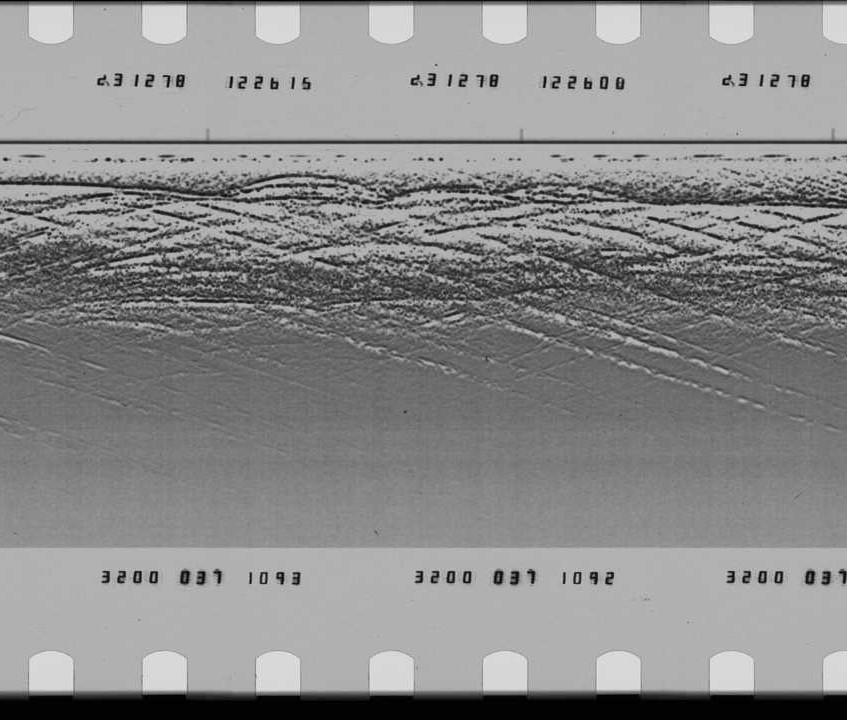
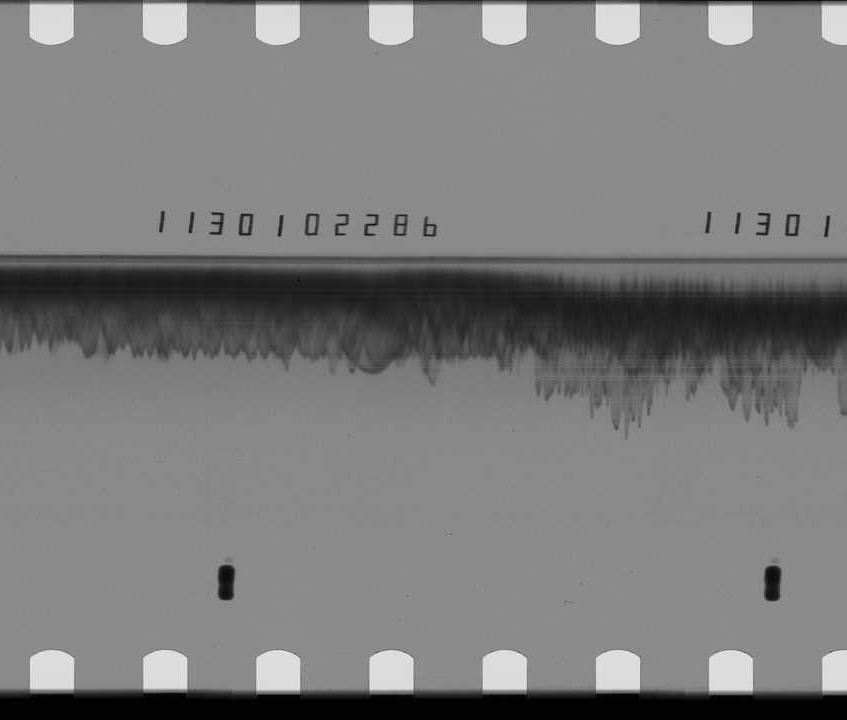
There are three types of data. Shown below from left to right are A-scopes, Z-scopes, and ESM-scopes.
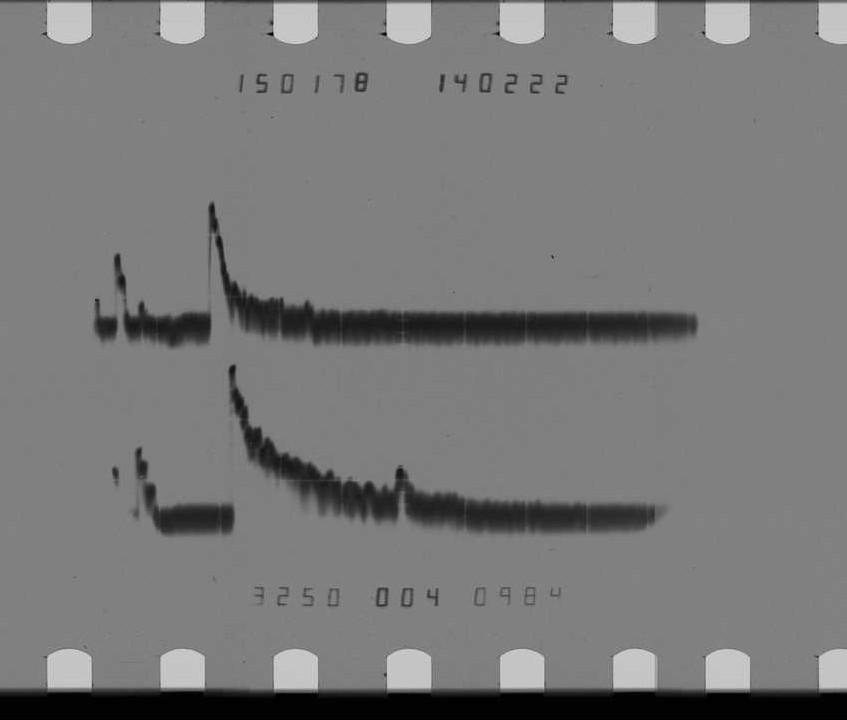
A-scope images contain sequences of 1D time vs returned power plots. You can interpret each spike as a reflection from something below the aircraft.
Z-scopes are the traditional radargram view. They show successive records of returned power as vertical lines. As the aircraft moves, the vertical lines end up tracing out something like a 2D profile of the ice. (Note that this is unfocused data.)
ESM-scopes are another representation of the data that is no longer commonly used. They're beyond the scope of this tutorial. (And you probably won't find that many of them anyway.)
If you're not sure what you're looking for, you probably want Z-scopes.
Individual film image views
After selecting images on the flight page, you'll see a list of each selected image and associated metadata.
You can scroll to zoom and drag to pan on the image itself. You can also use the "JPEG" link to download the image. The fields below the image show the metadata we have associated with this film image. With an account and permissions from us (see below), you can update this data if you find something that's incorrect.
These images are displayed in their original aspect ratio. Relative to how you're used to seeing radargrams, these will likely look very elongated to you. The stitched preview image at the top is shown at 1/5th the horizontal scale.
The images you can download from this tool are relatively high-quality but not the original resolution or format. If you need the original images, they are available from Stanford Libraries or you can get in touch with us.
Accounts
You don't need an account to use this tool, but there are some things (updating metadata, for instance) that require permission. We also have some secret (by which we really mean not polished enough to show publicly) tools for more flexibly stitching together the film images. If you're doing research with this data, you should reach out to us. We might be able to help!
Still have questions? Feel free to get in touch with us.
That's it! Go explore!